Enzymes in Action- Quantifying Milk Proteins

AUSTRALIAN CURRICULUM ALIGNMENT:
- Biochemical processes in the cell are controlled by the nature and arrangement of internal membranes, the presence of specific enzymes, and environmental factors
- Enzymes have specific functions, which can be affected by factors including temperature, pH, the presence of inhibitors, and the concentrations of reactants
BACKGROUND:
Trypsin is an enzyme which hydrolyses proteins into peptides, ready for other enzymes to cut them further down to their amino acids for use in the body. Enzymes are catalysts, which means they help or cause a reaction to occur without being consumed themselves. Trypsin works in the small intestine, after acid and pepsin in the stomach have commenced the work of breaking down the proteins.

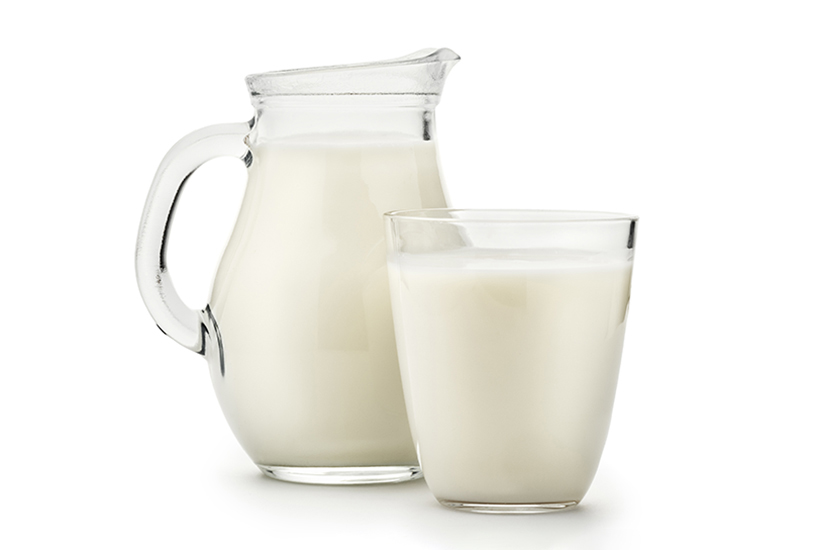
This experiment uses milk which contains the protein casein. As the casein in milk break down, the smaller molecules become soluble, thereby reducing the opacity of the fluid. The time taken to break down the molecules can be measured and comparison of known values against unknown values will allow the unknowns to be calculated. As the milk will not become entirely clear due to the inevitable presence of fat, some error will be introduced by varying decisions of the endpoint, not only amongst the class but each student may have their own inconsistencies. A colorimeter in transmittance mode may be used instead to reduce this type of error, however the visual assessment should be enough to demonstrate the basic principle. This experiment starts with known concentrations of skim milk powder. The concentration of protein itself can be calculated if you wish, from the information on the packet of milk; we have found skim milk generally contains around 9g of protein per 25g of powder (36%).
PREPARATION: LAB TECHNICIAN
- Dissolve 30g of skim milk powder in 250mL of distilled water (dH2O)
- Add distilled water to make 300mL for a 10% stock solution. (Adjust as appropriate for your class size – 300mL of stock should be enough for 12 groups with allowance for spillage). Dilute as follows:
- 5% standard – 75mL of stock in 75mL of dH2O
- 4% standard – 60mL of stock in 90mL of dH2O
- 3% standard – 45mL of stock in 105mL of dH2O
- 2% standard – 30mL of stock in 120mL of dH2O
- 1% standard – 15mL of stock in 135mL of dH2O
- Use the remaining milk to create two unknown samples (X and Y) within the range 1-5% eg 47mL of stock in 103mL of dH2O and 28mL of stock in 122mL of dH2O. Keep note of the concentration but do not reveal to students.
Trypsin stock solution:
- Dissolve 1g Trypsin in 100mL dH2O to make a 1% solution.
- Run a quick assay (see method below) to make sure that the 5% protein standard will take about 2-3 minutes to the end point.
- If the timing is appropriate, dissolve 4g Trypsin in 400mL dH2O to make the remainder of your 1% solution. If it’s too fast or too slow, adjust the dilution appropriately.
METHOD: STUDENT ACTIVITY
- Label your test tubes 1%, 2%, 3%, 4%, 5%, X and Y.
- To each tube add 10mL of the appropriate milk solution.
- Mark a black cross, approximately the size of the diameter of your test tubes, on the white paper.
- To the first tube (1%) add 5mL Trypsin solution. Start the timer and shake gently to mix. If you are wearing gloves, you may prefer to hold your thumb over the top of the tube and mix by inverting the tube, taking very good care that you have covered the top completely.
- Hold the cross behind the test tube and record the time it takes for it to become just visible.
- Repeat with the remaining tubes – keep consistent the point at which you determine the cross to be visible.
- Plot your results for the standards on your graph paper to more easily check for anomalies. If any result seems out of place and you need to re-run that standard, it is best to use clean test tubes as the enzyme can be difficult to clean out. If you need to re-use a tube, first place the 5mL of Trypsin and start your timer from when you add the milk.
- Once you are satisfied that your calibration curve makes sense, plot the results for your two unknowns to estimate the concentration of milk in each.
- The class results are to be collated and averaged out to make an aggregate calibration curve and estimate. Consider what you expect to see from aggregate results compared to individual.
OBSERVATIONS AND RESULTS
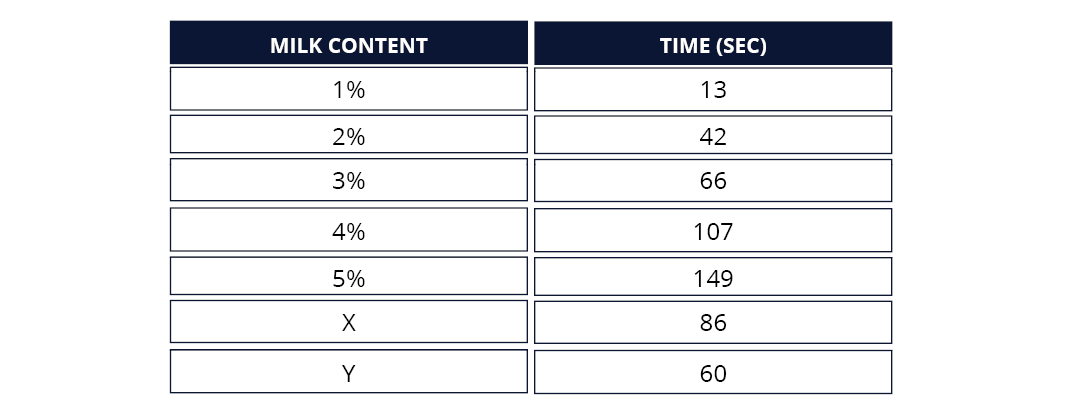
Below is an example of expected results. It is a guide only as individual results will vary.

INVESTIGATIONS:
- Ask students to compare the terms protein, peptide and amino acid.
- Discuss the reason that skim milk is used, and the error that may be introduced by the use of full-fat milk.
- Have your students consider the reason for starting from lowest concentration and moving upwards when using the same cylinder for measuring out the milk.
TEACHER TIP:
- If you use a colorimeter in transmittance mode, results should be more repeatable as it will not have the inconsistency caused by humans making different choices as to the end point. It may be worth having some experiments done on the colorimeter while others use the cross method, as a talking point about error in the scientific sense.
 Time Requirements
- 45 mins
 Material List
- Trypsin 1g
- Skim Milk Powder 30g
- Test Tubes x 7
- Test Tube Rack
- Measuring Cylinder for 5ml aliquots
- Measuring Cylinder for 10ml aliquots
- Timer/stopwatch
- Graph Paper
 Safety Requirements
- Apron required
- Safety Gloves Required
- Safety Goggles Required
- Ensure that students understand and adhere to safe conduct practices within the classroom.
