Taste and Genetics: Papillae density and PTC Tasting
- Biology
- Classroom Practicals
- Genetics
- Year 11 & 12

AUSTRALIAN CURRICULUM ALIGNMENT
- Conduct investigations, including the use of probabilities to predict inheritance patterns, real or virtual gel electrophoresis, and population simulations to predict population changes, safely, competently and methodically for the collection of valid and reliable data (ACSBL063)
BACKGROUND
Phenylthiocarbamide (PTC) is a nontoxic, chemical that resembles the alkaloid compounds found in some poisonous plants. The ability to taste PTC is controlled by the gene TAS2R38. Specific combinations of alleles determine whether a person finds PTC extremely bitter, slightly bitter, or tasteless. Individuals who are able to taste PTC are known as ‘tasters’. The ability to taste PTC varies even among ‘tasters’ based on the concentration of the chemical and the amount of time the tongue is exposed to PTC. The degree the saliva mixing with the PTC will also affect the duration and strength of sensation. Taste is more complex than simple genes, it is also influenced by anatomical factors, such as papillae density and taste experiences. The structures in our tongue enable our ability to taste. Taste buds are found within larger structures on the tongue called papillae. These receptors have the ability to detect even the slightest differences between molecules. The shape of the receptor and density will determine the binding strength between the taste molecule and receptor. Greater density in the receptor will produce a stronger taste sensation. The shape of the receptor is determined by a number of genetic factors, and the density of papillae on the tongue varies between individuals. People with higher papillae densities may be more sensitive to certain tastes.In this practical, students take part in an experiment to test the hypothesis that individuals with higher papillae density are more sensitive to PTC. Students have the opportunity to investigate the genetically controlled trait in the sample population of their class by using PTC taste strips. Students will not only test whether they are able to taste PTC but also the strength of sensation they experience. Students are introduced to category scales and asked to measure their own taste perception using a 9-point category scale. Commonly used for nutritional research, the category scale uses fixed and defined intervals from low to high. This practical provides an excellent introduction to methods of data collection; particularly with regards to measuring taste sensations and preferences. After recording their individual PTC sensitivity results, students add their results to the class data to create a greater sample size. These class results are to be compared to class papillae density results. To create this other data set for comparison, students place blue or green food colouring on their tongues in order to determine the density of their papillae. Students are then asked to collate the class’s papillae density data and compare it to class data regarding sensitivity to the chemical PTC. With these two data sets, students determine if there is any correlation between higher density papillae and greater sensitivity to the chemical PTC. This is an excellent opportunity for students to practice comparing two data sets to find statistical meaning.
METHOD - STUDENT ACTIVITY
PTC Tasting and Sensitivity Levels- Take a sip of water to clear your mouth of any other tastes.
- Place a strip of PTC paper on your tongue and let it remain there for a few minutes.
- Note any taste or sensation you perceive.
- On a scale of 1 to 9, record how bitter the PTC tastes. This is a category scale which uses fixed and defined intervals from low to high. Using the PTC sensitivity classification table below, determine the PTC sensitivity category you belong to.

Papillae Density Rating
- Gently dip a cotton swab into blue or green food colouring. To remove excess dye, squeeze onto a paper towel.
- Position paper reinforcement near the tip of your tongue. Coat the exposed circle of the reinforcement with the food colouring.
- Use mirror to aid you in this process, and make viewing easier.
- Take the reinforcement out of your mouth and swallow.
- The act of swallowing will wash the colouring off the largest papillae (called fungiform papillae) and thus, they will be a natural pink colour.
- The rest will remain stained green or blue; making the papillae more observable and easier to count.
- Replace the reinforcement back in the same position on your tongue and count the large papillae within the circle using a mirror or asking a partner to assist.
- Record your number of papillae in the area counted.
- Papillae density is classified from high to low. Using the Papillae Density classification table below, determine your density classification for your taste papillae.

- To compare the class population’s PTC sensitivity data with the papillae density data you will need to contribute to a class graph.
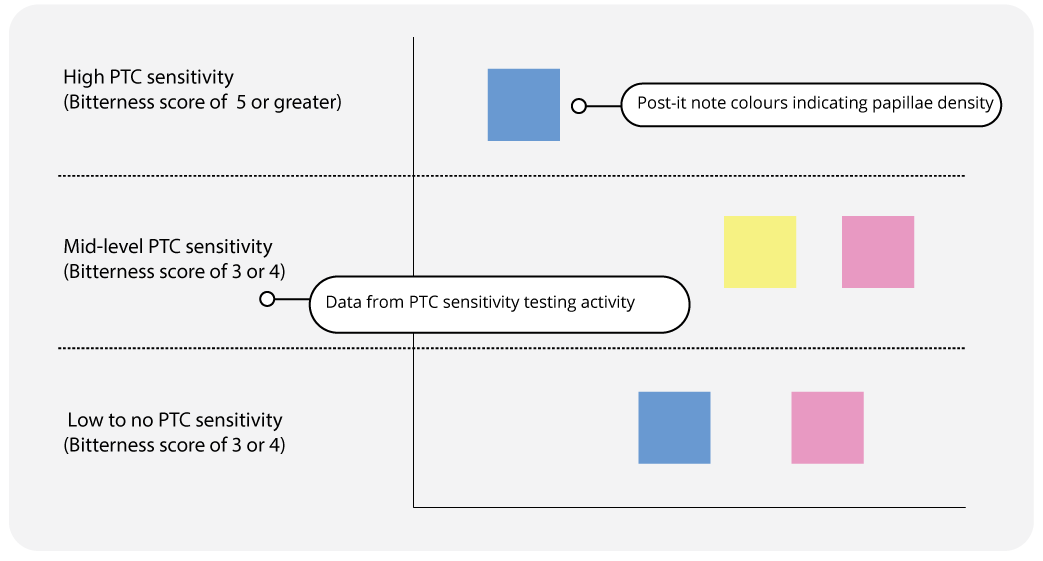
- Select a post-it note in a colour that matches your corresponding papillae density classification. See colour guide below.
- Place your appropriate coloured post-it in the section that corresponds with you PTC sensitivity levels.

OBSERVATION AND RESULTS
-
The class graph should look something like this:

Some students will find the PTC testing papers extremely bitter while others will experience a milder taste or none at all. For strong PTC tasters, the reaction to the test will be immediate and intense. You will most likely see a higher percentage of PTC tasters in your class, as on average 70% of people are able to taste PTC. You may observe a greater number of male PTC tasters, as females have higher non-taster phenotypes than males.
As the density of papillae on the tongue varies between individuals, the class population should generate a variety of low, mid and high-density papillae results. People with higher papillae densities may be more sensitive to certain tastes, however, there is no yet any conclusive scientific studies proving a direct correlation between papillae densities and PTC sensitivity. You may find that students with a higher papillae density are more sensitive to the taste of PTC; however, you may not find any correlation at all.
INVESTIGATION
- Ask students if they observed any trends or correlations.
- Discuss whether ‘high density’ individuals exhibit greater PTC sensitivity (find it more bitter) ‘mid-density’ individuals.
- As a class, examine the graph and determine if all ‘low density’ individuals are unable to taste PTC.
- Encourage students to consider whether it is possible that ‘mid-density’ people are heterozygotes for the PTC tasting gene, while ‘high density’ individuals have two copies of the gene.
EXTENSION EXERCISE
Ask students to form small groups of 3 or 4 and conduct a PTC sensitivity test each. In their groups, ask students to generate ‘rules’ based on the group test results. Example rules:
- Everyone tastes Thiourea as bitter
- People who taste PTC as bitter also taste Sodium Benzoate as bitter
- Only males are able to taste Sodium Benzoate.
- Individuals unable to taste PTC cannot taste any of the other papers.
Then ask students to compare the entire class results to their group's results and identify whether the ‘rules’ still apply. This is a great way to get students engaged in testing hypotheses and provides a clear demonstration that preliminary hypotheses can be refined after the collection of more data or a large data set.
 Time Requirements
- 55 mins
 Material List
- PTC papers (100 strips)
- Drinking water
- Cups
- Cotton swabs
- Blue or green food colouring
- Dish for food colouring
- Handheld mirror
- Paper reinforcements
- Paper towels
- Post-it notes
 Safety Requirements
- Wear appropriate personal protective equipment (PPE).
- Know and follow all regulatory guidelines for the disposal of laboratory wastes.
- Ensure you are aware of any food allergies or special requirements.
- PTC is safe when consumed in small amounts; do not exceed recommended amounts.
- The food colouring used in this practical is non-toxic; however, wear gloves to ensure the dye does not stain your skin.
- Wash your hands thoroughly after the activity.
